[[notes:cdend]]
Table of Contents
Colored dendrograms
A2R
Easter (April 7) 2012
On the R-GraphGallery we can find the Colored Dendrogram example.
- using R install the R-package
fpc(CRAN) - download the R-package
A2R(CRAN) on the fileA2R_0.0-4.tar.gz. There are some problems installingA2R(R-help,Stackoverflow). We proceed as follows: - download rtools and install them;
- include
rtoolsintoPATH:
c:\Rtools\bin;c:\Rtools\gcc-4.6.3\bin;c:\MiKTeX\miktex\bin;C:\R\R-2.14.0\bin\i386;c:\windows;c:\windows\system32; - download activeperl and install it;
- in the Run window run the command:
rcmd INSTALL e:/zip/R/A2R_0.0-4.tar.gz
Now the request library(A2R) in R should work.
See also More than six chars per label.
It seems that it works also by simply downloading the content of the last version/R into the map A2R and then
> setwd("C:/Users/Batagelj/work/R/A2R")
> require(fpc)
> require(grid)
> source("C:\\Users\\Batagelj\\work\\R\\A2R\\A2R.R")

> # examples with state.x77
> d77 <- dist(state.x77)
> h77 <- hclust(d77)
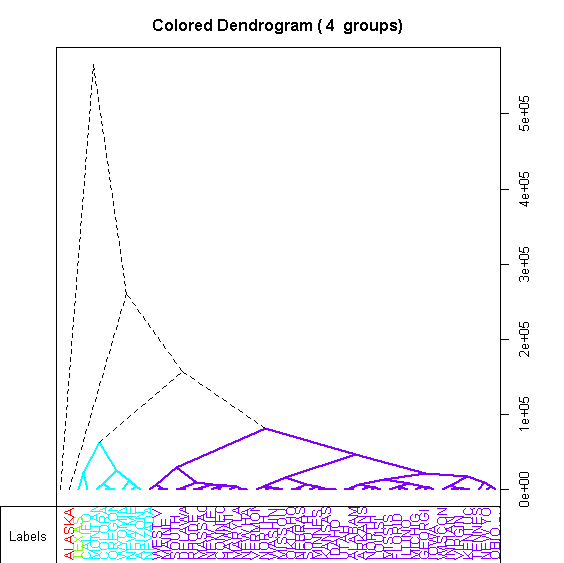
> A2Rplot(h77, k=4, knot.pos="mean", type="tri")
Coloring leaves of dendrogram
Searching for solution how to install A2R I found an alternative solution how to
Coloring leaves in a hclust or dendrogram plot.
I slightly modified the proposed solution so that the colors and sizes can be specified by 5 tables:
- labn[i] - node label
- labc[i] - label color
- labs[i] - label size
- dotc[i] - dot color
- dots[i] - dot size
The node with the label labn[i] will get the attributes specified in labc[i], labs[i], dotc[i] and dots[i].
> colLab <- function(n){
+  if(is.leaf(n)){
+    a <- attributes(n)
+    inds <- which(labn == a$label)
+    if ( length(inds) == 1 ){ i <- inds[1]
+      attr(n, "nodePar") <- c(a$nodePar, list(lab.col = labc[i], lab.cex=labs[i],
+           col=dotc[i], cex=dots[i], pch=16 ))
+    } else {
+ #     attr(n, "nodePar") <- c(a$nodePar, list(lab.col = "red", lab.cex=.7,
+ #          col="red", cex=pop[n], pch=16))
+    }}
+  n
+  }
>

> K <- sample(50)/50; B <- sample(50)/50
> y <- data.frame(K,B)
> labn <- paste('T',1:50,sep='')
> head(labn)
[1] "T1" "T2" "T3" "T4" "T5" "T6"
> rownames(y) <- labn
> head(y)
      K    B
T1 0.50 0.58
T2 0.92 0.80
T3 0.22 0.10
T4 0.34 0.94
T5 0.72 0.74
T6 0.96 0.62
> hc <- hclust(dist(y), "ward")
> plot(hc)
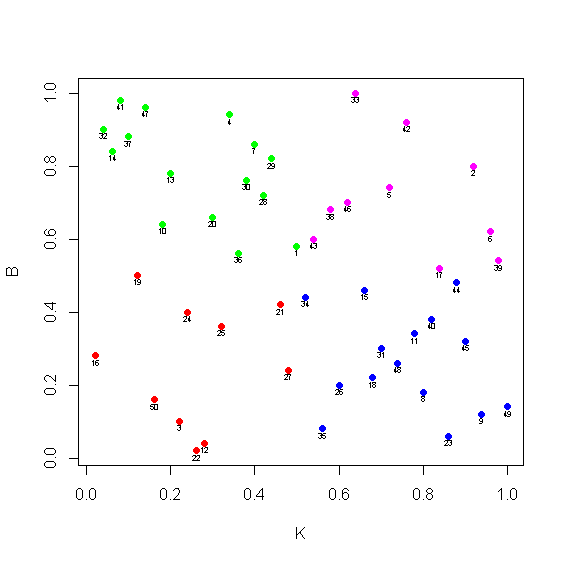
> cla <- (y$K>0.5)+2*(y$B>0.5)+1
> head(cla)
[1] 3 4 1 3 4 4
> col <- rep("black",50)
> col[cla==1] <- "red"
> col[cla==2] <- "blue"
> col[cla==3] <- "green"
> col[cla==4] <- "magenta"
> head(col)
[1] "green"   "magenta" "red"     "green"   "magenta" "magenta"
> labc <- col; dotc <- col
> labs <- rep(0.5,50); dots <- rep(0.3,50)
> plot(y,col=col,pch=16)
> text(y$K,y$B-0.016,1:50,cex=0.5)

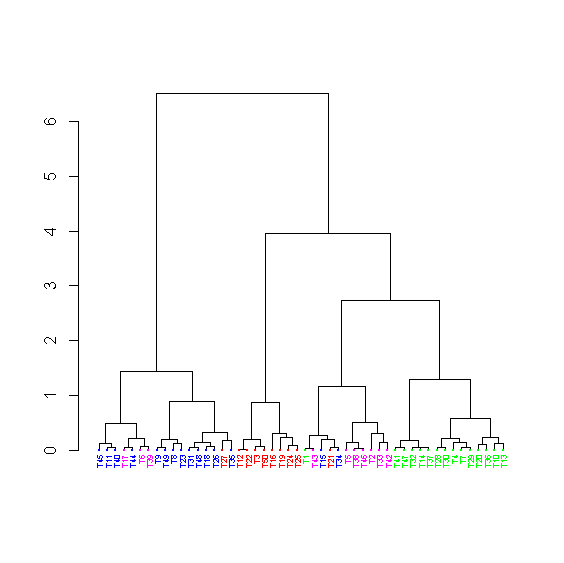
> dend <- as.dendrogram(hc,hang=-1)
> dend_colored <- dendrapply(dend, colLab)
> plot(dend_colored)
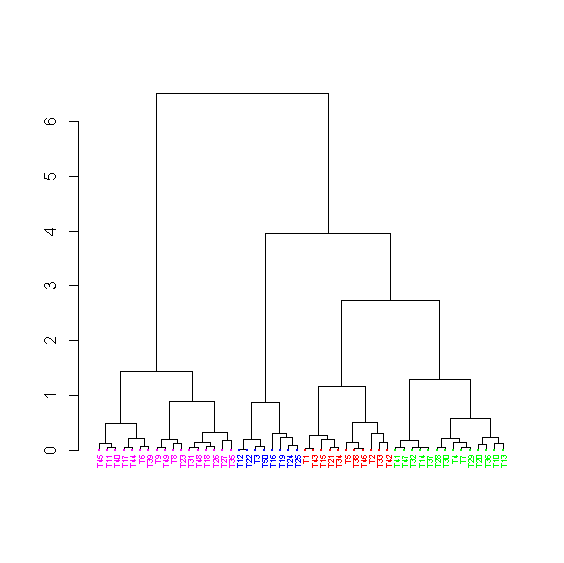
> clu <- cutree(hc,k=4)
> head(clu)
T1 T2 T3 T4 T5 T6
 1  1  2  3  1  4
> col[clu==1] <- "red"
> col[clu==2] <- "blue"
> col[clu==3] <- "green"
> col[clu==4] <- "magenta"
> head(col)
[1] "red"     "red"     "blue"    "green"   "red"     "magenta"
> labc <- col; dotc <- col
> dend <- as.dendrogram(hc,hang=-1)
> dend_colored <- dendrapply(dend, colLab)
> plot(dend_colored)
Except where otherwise noted, content on this wiki is licensed under the following license: CC Attribution-Noncommercial-Share Alike 3.0 Unported


