Coordinates
This note is a continuation of Displaying incomplete data on the map.
How to display only a selected part of the map?
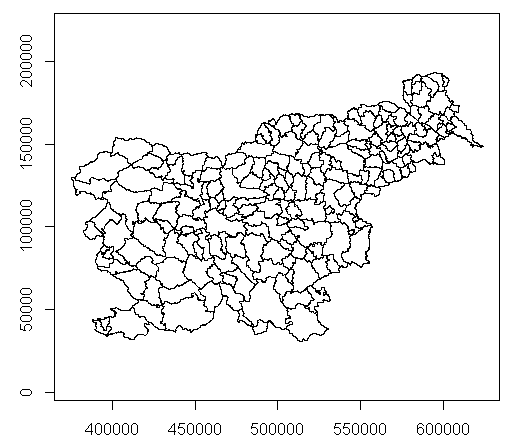
First we have to display the coordinates.
> plot(SI,axes=TRUE)
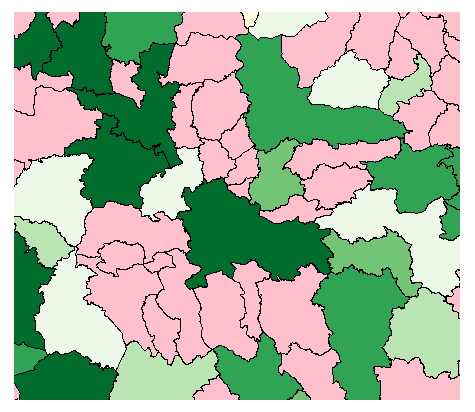
We select a port of the picture by specifying the parameters xlim and ylim. Let us display the neighborhood of Ljubljana:
> plot(SI,col=pal[ci],xlim=c(430000,500000),ylim=c(84000,129000),bg="lightyellow")
How to draw the given points?
Assume that we have the some position on the map, for example Ljubljana: 46°03'20”N 14°30'30”E . How to position it on the picture? The coordinates X_C and Y_C are the centers of communes - they are useless.
The first solution is to get the information about the extreme points of Slovenia
    North: 46°52'36”N 16°13'59”E, Šalovci,
    South: 45°25'19”N 15°10'0”E,  Črnomelj,
    East:  46°28'11”N 16°36'38”E, Lendava,
    West:  46°17'53”N 13°22'32”E, Kobarid.
and the corresponding picture coordinates using the bbox function
> bbox(SI)
        min      max
x 375209.19 624065.3
y  30853.18 193270.4
From these data we can determine the linear mappings of map coordinates (xM, yM) to picture coordinates (xP, yP):
xP = A*xM + B and yP = C*yM + D .
> NN <- 46+(52+36/60)/60; NE <- 16+(13+59/60)/60 # North: Šalovci,
> SN <- 45+(25+19/60)/60; SE <- 15+(10+ 0/60)/60 # South: Črnomelj,
> EN <- 46+(28+11/60)/60; EE <- 16+(36+38/60)/60 # East:  Lendava,
> WN <- 46+(17+53/60)/60; WE <- 13+(22+32/60)/60 # West:  Kobarid.
> LjN <- 46+(3+20/60)/60; LjE <- 14+(30+30/60)/60
> E <- c(NE,SE,EE,WE,LjE); N <- c(NN,SN,EN,WN,LjN)
> E
[1] 16.23306 15.16667 16.61056 13.37556 14.50833
> N
[1] 46.87667 45.42194 46.46972 46.29806 46.05556
> (bb <- bbox(SI))
        min      max
x 375209.19 624065.3
y  30853.18 193270.4
> my <- bb[2,1]; My <- bb[2,2]; mx <- bb[1,1]; Mx <- bb[1,2]
> A <- (Mx-mx)/(EE-WE); B <- mx - A*WE
> C <- (My-my)/(NN-SN); D <- my - C*SN
> (co <- cbind(A*E+B,C*N+D))
> co
         [,1]      [,2]
[1,] 595025.7 193270.41
[2,] 512992.5  30853.18
[3,] 624065.3 147835.76
[4,] 375209.2 128669.47
[5,] 462349.4 101594.77
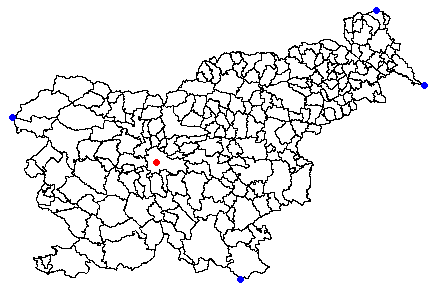
> plot(SI)
> points(co,pch=16,col=c(rep("blue",4),"red"))
The second solution is to get the information about the meaning of the picture coordinates. In Europe some variant of the Gauss-Krüger projection is usually used. After some searching on the WWW it seems that the current system used in Slovenia is MGI 1901 Slovene National Grid with EPSG number 3912 (see also 2170, 3787, 3794, and others for locally more precise conversions). The units in this system are meters. A support for projections is available in the package rgdal.
> library(rgdal)
> (cP <- cbind(E,N))
            E        N
[1,] 16.23306 46.87667
[2,] 15.16667 45.42194
[3,] 16.61056 46.46972
[4,] 13.37556 46.29806
[5,] 14.50833 46.05556
> cP_sp <- SpatialPoints(cP,proj4string=CRS("+proj=longlat +ellps=WGS84"))
> (MGI <- spTransform(cP_sp, CRS("+init=epsg:3912")))
SpatialPoints:
            E         N
[1,] 593975.6 193226.56
[2,] 513041.4  30837.61
[3,] 623670.8 148520.60
[4,] 374871.0 129464.57
[5,] 461960.4 101350.22
Coordinate Reference System (CRS) arguments: +init=epsg:3912 +proj=tmerc +lat_0=0
+lon_0=15 +k=0.9999 +x_0=500000 +y_0=-5000000 +ellps=bessel +units=m +no_defs
> plot(SI)
> points(coordinates(MGI),pch=16,col=c(rep("blue",4),"red"))
The precision of the results is in the range of 1km.
> coordinates(MGI)-co
               E          N
[1,] -1050.10041  -43.84313
[2,]    48.96126  -15.56588
[3,]  -394.46432  684.84265
[4,]  -338.21666  795.09904
[5,]  -388.98495 -244.55146
http://www.e-prostor.gov.si/si/zbirke_prostorskih_podatkov/drzavni_koordinatni_sistem/
URLs
- R-help: Gauss-Krüger coordinates system
- Tomislav Hengl: Wiki; Balkans coordinate systems
- Microimages: Coordinate Reference Systems
- GRASS 6.0: Coordinate systems
- Alexander Kolesnikov: Map Projections


