Map from WorldMap in R
http://egallic.fr/en/european-map-using-r/
> setwd("C:/Users/batagelj/Documents/papers/2018/CRoNoS/shape/Europe")
> library(ggplot2)
> library(grid)
> library(rworldmap)
> library(mapproj)
> worldMap <- getMap()
> names(worldMap)
 [1] "ScaleRank"    "LabelRank"    "FeatureCla"   "SOVEREIGNT"   "SOV_A3"
 [6] "ADM0_DIF"     "LEVEL"        "TYPE"         "ADMIN"        "ADM0_A3"
[11] "GEOU_DIF"     "GEOUNIT"      "GU_A3"        "SU_DIF"       "SUBUNIT"
[16] "SU_A3"        "NAME"         "ABBREV"       "POSTAL"       "NAME_FORMA"
[21] "TERR_"        "NAME_SORT"    "MAP_COLOR"    "POP_EST"      "GDP_MD_EST"
[26] "FIPS_10_"     "ISO_A2"       "ISO_A3"       "ISO_N3"       "ISO3"
[31] "LON"          "LAT"          "ISO3.1"       "ADMIN.1"      "REGION"
[36] "continent"    "GEO3major"    "GEO3"         "IMAGE24"      "GLOCAF"
[41] "Stern"        "SRESmajor"    "SRES"         "GBD"          "AVOIDnumeric"
[46] "AVOIDname"    "LDC"          "SID"          "LLDC"
> europe <- c("Austria","Belgium","Bulgaria","Croatia","Cyprus",
+   "Czech Rep.","Denmark","Estonia","Finland","France",
+   "Germany","Greece","Hungary","Ireland","Italy","Latvia",
+   "Lithuania","Luxembourg","Malta","Netherlands","Poland",
+   "Portugal","Romania","Slovakia","Slovenia","Spain",
+   "Sweden","United Kingdom",
+   "Albania","Andorra","Bosnia and Herz.","Gibraltar","Guernsey",
+   "Isle of Man","Jersey","Liechtenstein","Macedonia","Monaco",
+   "Montenegro","San Marino","Serbia","Switzerland","Armenia",
+   "Azerbaijan","Belarus","Faroe Is.","Georgia","Iceland",
+   "Jan Mayen","Moldova","Svalbard","Turkey","Ukraine","Russia",
+   "Vatican","Kosovo")
> p <- match(europe,worldMap$NAME)
> europe[which(is.na(p))]
[1] "Gibraltar" "Jan Mayen" "Svalbard"
> indEU <- which(worldMap$NAME%in%europe)
> europeCoords <- lapply(indEU, function(i){
+   df <- data.frame(worldMap@polygons[[i]]@Polygons[[1]]@coords)
+   df$region =as.character(worldMap$NAME[i])
+   colnames(df) <- list("long", "lat", "region")
+   return(df)
+ })
> europeCoords <- do.call("rbind", europeCoords)
> head(europeCoords)
      long      lat  region
1 20.59025 41.85540 Albania
2 20.46318 41.51509 Albania
3 20.60518 41.08623 Albania
4 21.02004 40.84273 Albania
5 20.99999 40.58000 Albania
6 20.67500 40.43500 Albania
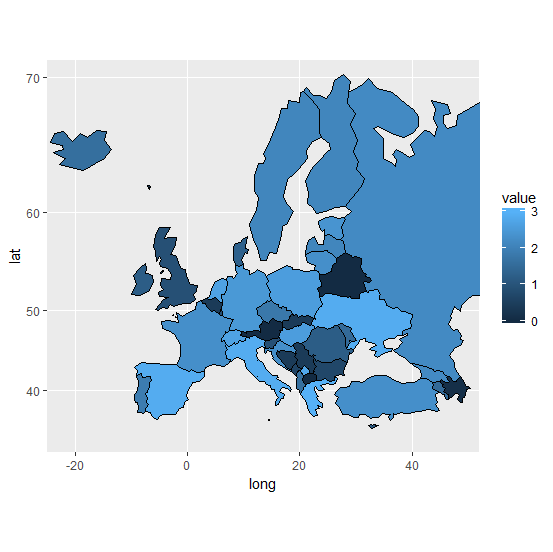
> value <- sample(x=seq(0,3,by=0.1),size=length(europe),replace=TRUE)
> europeTable <- data.frame(country=europe,value=value)
> europeCoords$value <- europeTable$value[match(europeCoords$region,europeTable$country)]
> P <- ggplot() + geom_polygon(data=europeCoords,
+   aes(x=long,y=lat,group=region,fill = value),colour="black",size=0.1) +
+   coord_map(xlim=c(-25,52),ylim=c(31,71))
> P
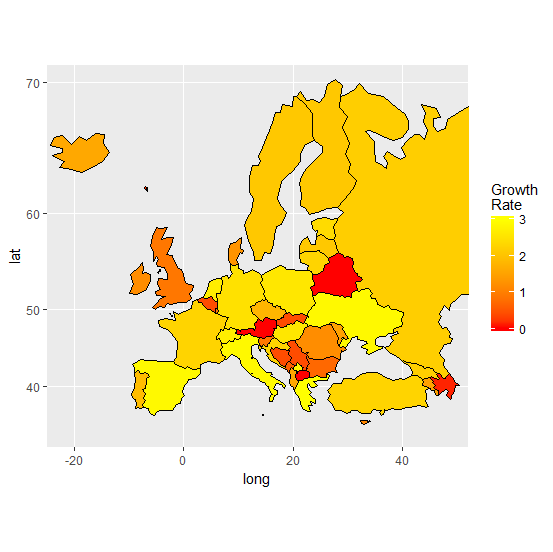
Possible improvements:
> P <- P + scale_fill_gradient(name="Growth\nRate",low="#FF0000FF",high="#FFFF00FF",na.value="grey50")
> P
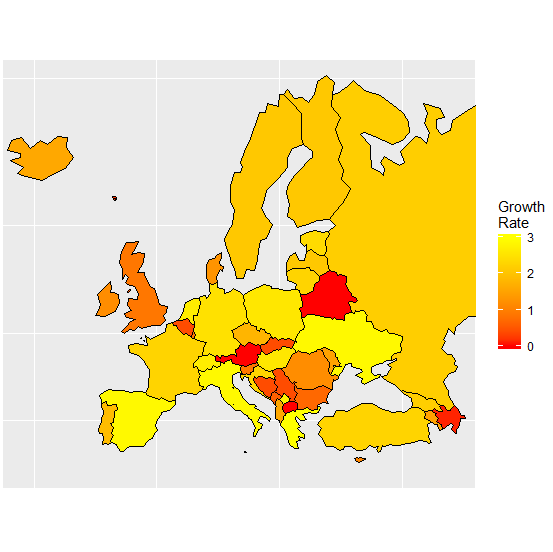
> P <- P + theme(#panel.grid.minor=element_line(colour=NA),panel.grid.minor=element_line(colour=NA),
+   #panel.background = element_rect(fill=NA,colour=NA),
+   axis.text.x=element_blank(),axis.text.y=element_blank(),axis.ticks.x=element_blank(),
+   axis.ticks.y=element_blank(),axis.title=element_blank(),#rect=element_blank(),
+   plot.margin=unit(0*c(-1.5,-1.5,-1.5,-1.5),"lines"))
> P
Except where otherwise noted, content on this wiki is licensed under the following license: CC Attribution-Noncommercial-Share Alike 3.0 Unported


