[[notes:da:euahc]]
Table of Contents
Hierarchical clustering without constraints
Clustering
load('C:/Users/batagelj/Downloads/data/CIA/CIAeu.Rdata')
CIAeu
n <- nrow(CIAeu)
S <- scale(CIAeu)
DD <- dist(S)
t <- hclust(DD,method="ward.D")
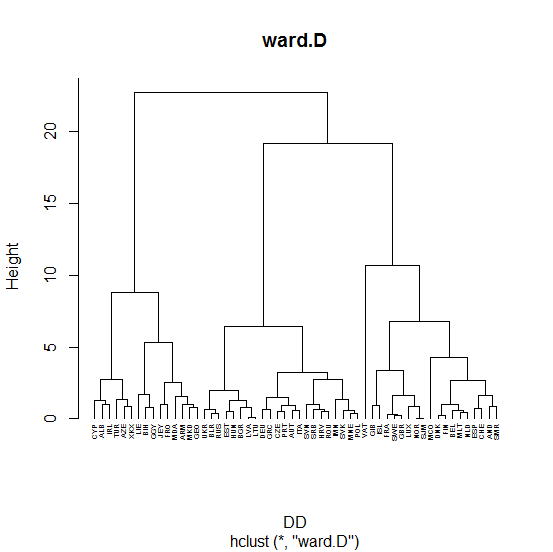
plot(t,hang=-1,main="ward.D",cex=0.4)
> p <- cutree(t,k=3)
> for(i in 1:3){cat("C",i,"\n"); print(summary(CIAeu[p==i,]))}
C 1
     UrbPop        BirthRate       DeathRate        MedAtot
 Min.   :14.30   Min.   : 8.80   Min.   : 6.00   Min.   :29.10
 1st Qu.:41.25   1st Qu.:11.35   1st Qu.: 6.90   1st Qu.:34.00
 Median :55.20   Median :12.40   Median : 7.80   Median :36.80
 Mean   :50.31   Mean   :12.53   Mean   : 8.36   Mean   :36.69
 3rd Qu.:60.90   3rd Qu.:14.05   3rd Qu.: 9.30   3rd Qu.:38.05
 Max.   :74.40   Max.   :15.80   Max.   :12.60   Max.   :43.80
C 2
     UrbPop         BirthRate       DeathRate         MedAtot
 Min.   : 74.10   Min.   : 0.00   Min.   : 0.000   Min.   :34.70
 1st Qu.: 82.05   1st Qu.: 9.65   1st Qu.: 8.100   1st Qu.:39.90
 Median : 88.00   Median :10.90   Median : 8.900   Median :41.80
 Mean   : 88.74   Mean   :10.31   Mean   : 8.316   Mean   :42.34
 3rd Qu.: 94.95   3rd Qu.:12.15   3rd Qu.: 9.400   3rd Qu.:42.65
 Max.   :100.00   Max.   :14.00   Max.   :10.300   Max.   :55.00
C 3
     UrbPop        BirthRate        DeathRate        MedAtot
 Min.   :49.60   Min.   : 8.200   Min.   : 9.60   Min.   :39.60
 1st Qu.:59.83   1st Qu.: 8.900   1st Qu.:10.43   1st Qu.:40.80
 Median :66.95   Median : 9.400   Median :11.85   Median :42.65
 Mean   :65.80   Mean   : 9.436   Mean   :12.01   Mean   :42.63
 3rd Qu.:72.78   3rd Qu.: 9.975   3rd Qu.:13.43   3rd Qu.:43.92
 Max.   :78.60   Max.   :11.000   Max.   :14.60   Max.   :47.10
> A3net <- c("SJM","ALB","AND","AUT","BEL","BIH","HRV","CZE","DNK","EST","FIN","FRA","DEU",
+   "GIB","GRC","GGY","HUN","IRL","IMN","ITA","JEY","LVA","LIE","LTU","LUX","MKD","MLT",
+   "MCO","MNE","NLD","NOR","POL","PRT","SMR","SRB","SVK","SVN","ESP","SWE","CHE","GBR",
+   "ARM","AZE","BLR","BGR","FRO","GEO","ISL","MDA","ROU","TUR","UKR","RUS","CYP","VAT","XKX")
> A3df <- rownames(CIAeu)
> p
ALB AND AUT BEL BIH HRV CZE DNK EST FIN FRA DEU GIB GRC GGY HUN IRL IMN ITA JEY LVA LIE
  1   2   3   2   1   3   3   2   3   2   2   3   2   3   1   3   1   3   3   1   3   1
LTU LUX MKD MLT MCO MNE NLD NOR POL PRT SMR SRB SVK SVN ESP SWE CHE GBR ARM AZE BLR BGR
  3   2   1   2   2   3   2   2   3   3   2   3   3   3   2   2   2   2   1   1   3   3
FRO GEO ISL SJM MDA ROU TUR UKR RUS CYP VAT XKX
  1   1   2   2   1   3   1   3   3   1   2   1
> P <- match(A3net,A3df)
> q <- p[P]
> q
SJM ALB AND AUT BEL BIH HRV CZE DNK EST FIN FRA DEU GIB GRC GGY HUN IRL IMN ITA JEY LVA
  2   1   2   3   2   1   3   3   2   3   2   2   3   2   3   1   3   1   3   3   1   3
LIE LTU LUX MKD MLT MCO MNE NLD NOR POL PRT SMR SRB SVK SVN ESP SWE CHE GBR ARM AZE BLR
  1   3   2   1   2   2   3   2   2   3   3   2   3   3   3   2   2   2   2   1   1   3
BGR FRO GEO ISL MDA ROU TUR UKR RUS CYP VAT XKX
  3   1   1   2   1   3   1   3   3   1   2   1
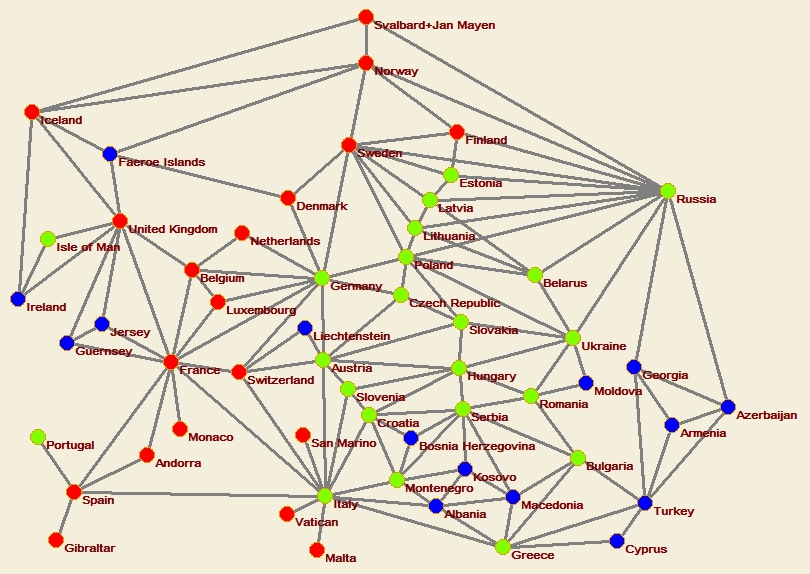
Export the partition q to Pajek
> clu <- file("C:/Users/batagelj/Documents/papers/2018/CRoNoS/shape/europe/hc-3.clu","w")
> # cat("%",paste(1:length(lev),' "',lev,'"  ',sep=''),'\n',file=clu)
> cat("*vertices",n,"\n ",file=clu)
> cat(paste(as.integer(q),'\n',sep=''),file=clu)
> close(clu)
and display it on the constraint relation
The other, better, option is that we reorder data table so that it is compatible with network
> head(CIAeu)
    UrbPop BirthRate DeathRate MedAtot
ALB   59.3      13.2       6.8    32.9
AND   84.1       7.5       7.3    44.3
AUT   66.1       9.5       9.6    44.0
BEL   97.9      11.3       9.7    41.4
BIH   40.1       8.8      10.0    42.1
HRV   59.6       8.9      12.2    43.0
> EuCIA <- CIAeu[P,]
> head(EuCIA)
    UrbPop BirthRate DeathRate MedAtot
SJM   81.0      12.2       8.1    39.2
ALB   59.3      13.2       6.8    32.9
AND   84.1       7.5       7.3    44.3
AUT   66.1       9.5       9.6    44.0
BEL   97.9      11.3       9.7    41.4
BIH   40.1       8.8      10.0    42.1
> save(EuCIA,ascii=TRUE,file='C:/Users/batagelj/Downloads/data/CIA/EuCIA.Rdata')
> n <- nrow(EuCIA)
> S <- scale(EuCIA)
> DD <- dist(S)
> t <- hclust(DD,method="ward.D")
> plot(t,hang=-1,main="Europe hc / ward.D",cex=0.4)
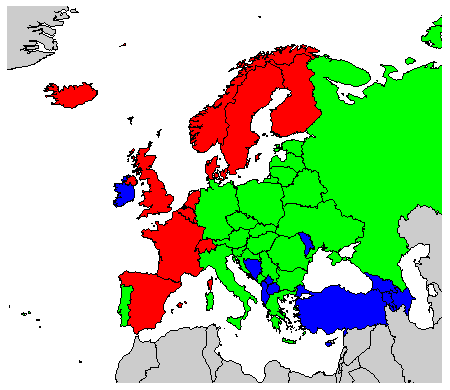
Presenting clustering on the map
> load('C:/Users/batagelj/Downloads/data/CIA/EuCIA.Rdata')
> setwd("C:/Users/batagelj/Documents/papers/2018/CRoNoS/shape/nEarth")
> library(maptools)
> gpclibPermit()
> library(RColorBrewer)
> library(reshape)
> map <- readShapeSpatial("ne_50m_admin_0_countries", proj4string = CRS("+proj=longlat"))
> A3map <- as.character(map$ISO_A3)
> n <- length(A3map)
> A3net <- c("SJM","ALB","AND","AUT","BEL","BIH","HRV","CZE","DNK","EST","FIN","FRA","DEU",
+   "GIB","GRC","GGY","HUN","IRL","IMN","ITA","JEY","LVA","LIE","LTU","LUX","MKD","MLT",
+   "MCO","MNE","NLD","NOR","POL","PRT","SMR","SRB","SVK","SVN","ESP","SWE","CHE","GBR",
+   "ARM","AZE","BLR","BGR","FRO","GEO","ISL","MDA","ROU","TUR","UKR","RUS","CYP","VAT","XKX")
> P <- match(A3net,A3map)
> Q <- match(A3map,A3net)
> i <- which(A3map=="-99")
> A3map[i] <- c("ATC","CYN","FRA","IOA","KAS","XKX","NOR","SOL")
> n <- nrow(EuCIA)
> S <- scale(EuCIA)
> DD <- dist(S)
> t <- hclust(DD,method="ward.D")
> plot(t,hang=-1,main="ward.D",cex=0.4)
> p <- cutree(t,k=3)
> A3eu <- rownames(EuCIA)
> K <- match(A3eu,A3map)
> N <- length(A3map)
> N
[1] 241
> C <- rep("grey80",N)
> A3eu[which(is.na(K))]
[1] "GIB" "SJM"
> s <- which(!is.na(K))
> C[K[s]] <- c("red","blue","green")[p[s]]
> plot(map,xlim=c(-21,45),ylim=c(32,74),col=C)
Except where otherwise noted, content on this wiki is licensed under the following license: CC Attribution-Noncommercial-Share Alike 3.0 Unported


